
Literature Review… As A Network?

If you are currently working on your term paper or writing your final thesis, we highly recommend taking a look at the article on this topic that was written by Anastasia Vlasenko and published on our website a couple of days ago. It contains a whole bunch of practical advice that can help you out with kicking off a successful research paper. Assuming you took some notes and now feel ready to get started, we are here today to introduce you to a program called VOSviewer that will make writing a literature review a lot easier. Let’s get started.
Hopefully, you’ve already heard of one of the largest and time-consuming parts of any academic research article – a literature review. One is supposed to demonstrate his knowledge of how a particular field was developing, describe the current state of affairs, highlight particularly important central works and on-going debates. While one is expected to review and analyze theories that are present and widely used in the field, they are also supposed to cite empirical research that uses them as a theoretical framework. In fact, it might feel quite overwhelming and seem like what you are asked to do in this section is to simply read all the works in the field. You may start reading a particular article and quickly realize that you simply lack knowledge of the concepts and theories mentioned there. Naturally, you would probably scroll all the way down to the reference list and try to dive deeper into the topic by checking out those articles that the one you are currently reading are based on. Guess what? It’s a trap! You would be stuck in a never-ending process of finding something that you don’t know, reading an article about it, then finding something else you don’t know in it over and over, again and again. Just as Aristotle once wrote:
The more you know, the more you realize you don't know.
What you need to acquire before you start reading all of these articles is, in fact, an understanding of how your research field is organized. That implies, first of all, knowing which works laid foundations of the most important theories in the field. Additionally, if there are multiple competing schools of thought in the field you also need to take that into account and understand in regard to which particular points these scholars cannot reach a consensus. As time goes by, some theories merge together, some of them, on the contrary, become divided into separate ones based on very slight differences. We get it, it’s extremely hard to understand what was happening in a field dozens and hundreds years ago. Understanding the currently observed structure of the field is an equally demanding task.
If you already have experience of writing a literature review, we are quite sure you know exactly what we are talking about. If it’s your first time working on a research paper, please don’t freak out – we are here to help you solve all the problems that come with it.
A program that we are going to introduce today is called VOSviewer and it is a software tool for visualizing various networks. Main metrics that are used for the construction of these include: citation, bibliographic coupling, co-citation and co-authorship relations. On top of that, one can also create term co-occurrence maps based on the titles and abstracts of research publications. The software is free, very easy to use and comes with the manual to clarify all the questions you might have. We, Sociology and Social Informatics students, were introduced to this software by one of our professors and have been using it ever since.
Let me give you an example to make it easier to understand what all of it is about. We were working on a project for our Social studies of Health and Wellbeing class where we would have to analyze articles from a particular sub-field connected to health studies. Our team decided to review articles on a topic of how COVID-19 pandemic has affected people’s mental health. However, since this field is changing rapidly with new articles being published every day, it was important for us to understand what we had to work with. We decided to construct a term co-occurrence map based on the articles that would satisfy our research query. To put it simply, we chose articles that were related to COVID-19 or “Corona virus” and qualified to be automatically sorted into the Psychiatry section of the citation database. Where did we get the data you might ask. In fact, we used what all HSE students have access to – our digital library. In particular, we searched for articles with the help of Web of Science database and picked a total of 1431 entities.
Once the information on those articles was loaded to VOSviewer software, we proceeded to specify some of the parameters, such as minimal cluster size, and created a network that you can see below (pic.1). Take a look.
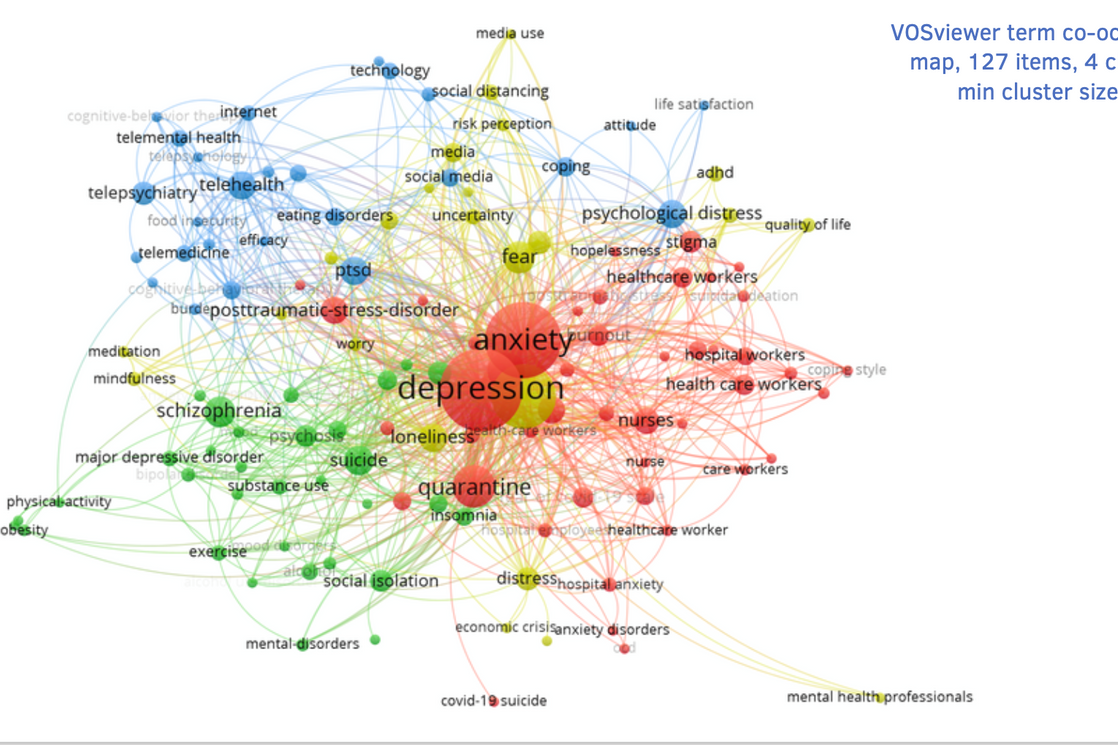
Did we set your expectations way too high and now you are a bit disappointed because you can barely understand what is happening on the map? No worries. Let me explain. Overall, it appears to be quite clear that there are four main clusters on the map all indicated by different colors: green one, blue one, yellow one, red one. Additionally, nodes “Depression” and “Anxiety” that belong to the red cluster seem to be the biggest ones. What does that mean you ask? That means that in all the articles (to be precise, their titles and abstracts) this software has analyzed those two terms occurred the most frequently. Based on the connections (citations) between articles, they were ascribed to the red cluster.
Now let’s take a look at the clusters and hypothesize what each of them might be about. First off, the red cluster. It appears quite obvious that the majority of terms in it are in one way or another connected to the medical field professionals - nurses and health care workers - in general. Therefore, articles in the red cluster mostly deal with mental health consequences of treating COVID-19 patients that nurses and other specialists have to deal with. These, for instance, include burnout and feeling of hopelessness that are represented by smaller nodes. Blue cluster clearly has to do with the way medical field had to change because of the pandemic and highlights the importance of technology and telemedicine - medical services that are delivered online. The blue cluster is interweaved with the yellow one since, as it seems like, both of them are connected to the use of internet. Unlike blue cluster, the yellow one is likely to deal with mental health consequences of staying online a lot more, probably, to monitor the news (“media use”, “social media”). Terms that are associated with the news overload include: “fear”, “uncertainty”, “loneliness”. The last cluster is the green colored one. As we hypothesized, articles that were ascribed to this cluster are closely connected to the consequences of the COVID pandemic that patients with various serious mental health issues have to deal with (i.e “Schizophrenia”). Alternatively, this cluster could also include articles that elaborate on particular mental health problems the development of which the pandemic could possibly contribute to (i.e major depressive disorder). Such terms as “exercise” and “physical activity” most probably indicate that some articles propose those among ways to deal with negative mental health outcomes the pandemic can bring about. Please remember that clusters can be interpreted differently and what we are doing here is simply hypothesizing. These maps are always open to interpretation!
Now that we are done with explaining what this example was all about, do you feel like you understand how useful such networks can be and how to interpret them? We really hope you do. As you can see, a simple term co-occurrence map can provide you information on the general structure of the field that you are working with. You can either choose one of these clusters and dive into that particular topic or use this knowledge to briefly discuss all of these topics in your literature review. Building such networks is a great first step to take on your way to writing a brilliant work.
Another two very useful networks that you can build using VOSviewer is a bibliographic coupling or a co-citation network. In case of the former the nodes would be connected based on the papers they cite, in case of the latter those papers that are cited together in a particular work are connected. When it comes to these two types of networks, you’d be able to see not the terms used in those papers, but their authors. What’s even better is that if you click on a particular node you will be able to see all the information about the article that it represents: it’s title, year of publication, author, abstract etc. Some of them even have hyperlinks. Since it’s the authors from a similar field that usually cite each other, these maps will provide you with a slightly different perspective on the structure of your field of interest even if they appear similar to the structure you saw in a term co-occurrence map. Additionally, prior to downloading the data from Web of Science or any other scientific citation database you can divide your search results into several time periods. By doing that you gain an advantage of being able to build a network for each of those time periods and observe how the structure of the field changed through time. Most cited authors that appear in the network built for the very first time period are most probably those whose works were fundamentally important for the field – look at those and analyze what they wrote about, whether there were several of them, how did the field grow after their works were published.
Building such networks prior to writing your literature review gives you a huge advantage and saves a lot of time that you could simply waste by trying to read all the articles in the field. Instead of endless reference lists you get networks that visualize the structure of the field, most important works and authors, widely used terms, rivalry schools of thought. Once you master “reading” these maps, it would be easy for you to both write a well-structed literature review that reflects what is going on in the field and focus on those works that are of particular importance to each cluster.
There is a lot more you can do with VOSviewer, but we won’t discuss it here so that there is a bit of a mystery left. Hopefully, we were convincing enough to make you download the software and give it a try. From that point on it’s up to you to decide which particular networks to build and which areas to do your research on.
Good luck!
Text by
Nadezhda Bykova